Microservices Observability
Aug 25, 2022

By Alexandr Ivenin, Systems Technical Lead, ClearScale
Effective debugging and anomaly detection are both important in the continuous deployment process for business applications. Microservices observability can help developers understand why some service calls fail and what might be the source of application workflow bottlenecks.
Microservices observability is also useful for setup rollback procedures that are based on business or system metrics. With all application information in one place, developers can effectively evaluate the load of critical components, reduce time to market, and analyze and detect operational anomalies in real time.
Challenges
Сompared to classic applications that run in virtualized infrastructure, containers come with features and characteristics that add some complexity when it comes to observability. These include:
Ephemeral behavior
The container lifecycle is different from those of virtual machines – it can be very short. Containers also typically don’t have state. However, with containers, metrics and logs are still relevant, even if the container lifecycle is only a few seconds.
Vast deployment
A single container can contain significant business logic, and one application can consist of hundreds of containers. Furthermore, each container may produce thousands of metrics and logs, making it much harder to debug cross-container communications and systems. This is why tracing and container discovery are becoming more important.
Resource Sharing
Containers also share host resources, which makes it tricky to monitor resource usage on the physical host. Not only is it challenging to monitor CPU and memory, but it’s also hard to follow network usage as well. Moreover, Docker adds an additional level of complexity on the resource-sharing front.
Microservices Observability Solutions
Given these challenges, let’s review what solutions and approaches are available to enable microservices observability in AWS.
Logging
Logging is an especially important part of every infrastructure. Without logging in place, troubleshooting technical issues is more difficult, and gaining operational insight and intelligence is almost impossible.
There are a few ways to set up a centralized logging solution for microservices:
CloudWatch Logs
Amazon CloudWatch Logs can be used to monitor, store, and access log files from Amazon Elastic Container Service, Amazon Elastic Kubernetes Service, and Kubernetes platforms on Amazon EC2. The metrics available through CloudWatch include the utilization of resources such as CPU, memory, disk, and network.
Container Insights also provides diagnostic information, such as container restart failures, to help developers isolate issues and resolve them quickly. CloudWatch Logs enable teams to centralize logs across all your systems, applications, and AWS services in use in a single, highly scalable service. Developers can then easily view these logs, search for specific error codes or patterns, filter based on specific fields, or archive them securely for future analysis.
Additionally, CloudWatch Logs Insights enables developers to interactively search and analyze log data in Amazon CloudWatch Logs. Teams can perform queries to more efficiently and effectively respond to operational issues. If an issue occurs, CloudWatch Logs Insights helps identify potential causes and validate deployed fixes.

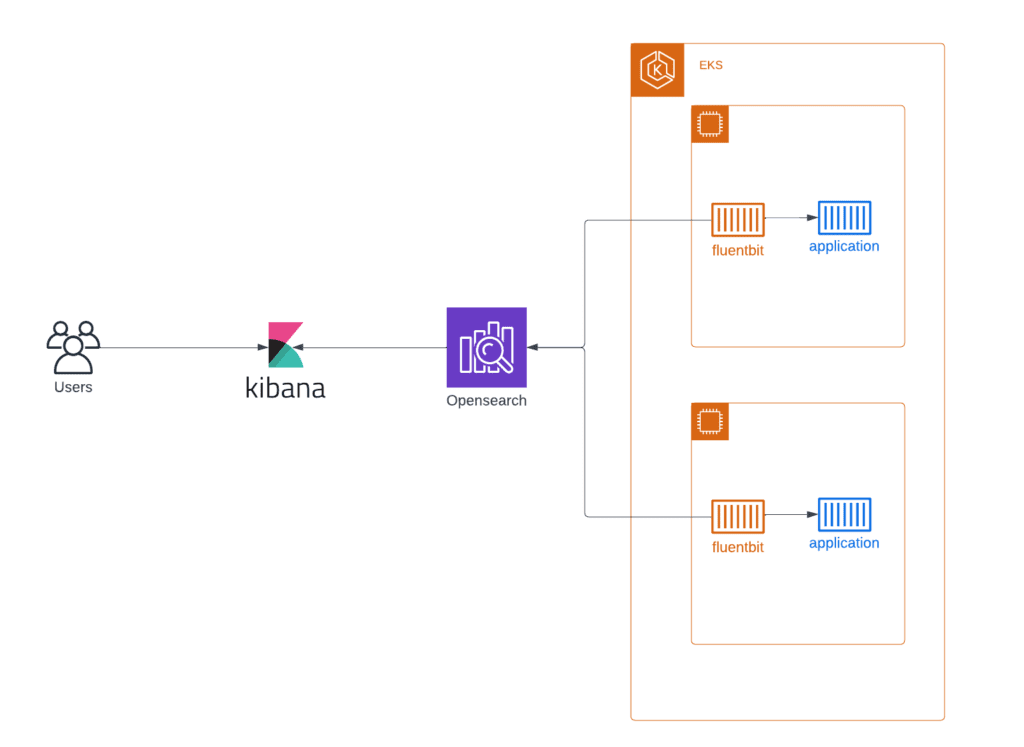
Opensearch Based Logging
The logging stack consists of several components – Opensearch, Logstash or Fluentbit, and Kibana. In this stack, Opensearch is a real-time, distributed, and scalable search engine that allows for full-text and structured search, as well as analytics. Logstash or Fluentbit are server-side data processing pipelines that ingest data from multiple sources simultaneously, transform it, and then send it to a “stash” like Opensearch.
Kibana lets users visualize data with charts and graphs in Opensearch. Kibana, delivered together with AWS-managed Opensearch, makes it possible to secure Elasticsearch logs using authentication with Cognito.
Opensearch, Fluentbit, Kibana
For small to medium-sized environments, stacks with OpenSearch, Fluentbit, and Kibana can be used with containerized applications (AWS ECS or AWS EKS). Opensearch is a powerful tool that enables developers to easily ingest, secure, search, aggregate, view, and analyze data. It can be easily deployed by Terraform template and ready for logs processing within half an hour.
Plus, the architecture can be extended with AWS-managed MSK as a caching tier for huge installations. AWS MSK is an effective service for buffering incoming log streams from many containers before they get processed by Fluentbit and sent in Opensearch. With a caching tier, this stack can process vast amounts of incoming logs.
Third-Party Tools for Microservices Observability
If companies already have a central logging solution and want to collect system and application logs from EKS, developers can use fluentbit and configure sending logs to all popular logging systems. Fluentbit supports Splunk, DataDog, New Relic, and many other systems.
Metrics
Prometheus
Prometheus is an open-source systems monitoring and alerting toolkit originally built at SoundCloud. Prometheus is an industry-standard solution for monitoring cloud applications and infrastructure, particularly those built with cloud-native technologies like Kubernetes.
Prometheus’s key features include:
- A multi-dimensional data model with time series data identified by metric name and key/value pairs
- PromQL, a flexible query language to leverage this dimensionality
- No reliance on distributed storage; single server nodes are autonomous
- Time series collection via a pull model over HTTP
- Pushing time series supported via an intermediary gateway
- Target discovery via service discovery or static configuration
- Multiple modes of graphing and dashboarding support
The diagram illustrates the architecture of Prometheus and some of its ecosystem components.

Amazon Managed Service for Prometheus

Amazon Managed Service for Prometheus (AMP) is a serverless, Prometheus-compatible monitoring service for container metrics. It makes it easier to securely monitor container environments at scale.
With AMP, developers can use the same open-source Prometheus data model and query language that they use to monitor the performance of containerized workloads. The benefits are improved scalability, availability, and security without having to manage the underlying infrastructure.
Prometheus Federation
Federation allows developers to pull aggregates up the hierarchy to a global Prometheus server. External labels, metrics path, and match fields are required in the default Prometheus configuration yml to set up federation configuration. To federate data from two or more Prometheus servers, teams must launch the Prometheus service as a Global Prometheus service and pass Global Prometheus server endpoints as targets to the slave Prometheus service.
This helpful feature collects metrics from all EKS clusters and organizes long-term metrics storage. Typically, each EKS cluster has its own Prometheus server for short-term metrics. Global Prometheus server collects metrics from all clusters with a higher scrape interval for infrequently used metrics. It can be helpful when developers need to analyze system behavior over a long period of time. Amazon Managed Service for Prometheus is a suitable solution for the global Prometheus server.

CloudWatch Insights
Another option for metrics is AWS CloudWatch Container Insights. Developers can use CloudWatch Container Insights to collect, aggregate, and summarize metrics and logs from containerized applications and microservices. Container Insights is available for Amazon Elastic Container Service (Amazon ECS), Amazon Elastic Kubernetes Service (Amazon EKS), and Kubernetes platforms on Amazon EC2. Amazon ECS support includes support for Fargate.
CloudWatch automatically collects metrics for many resources, such as CPU, memory, disk, and network. Container Insights also provides diagnostic information, such as container restart failures, to help teams isolate issues and resolve them quickly. Developers can also set CloudWatch alarms on metrics that Container Insights collects.
It’s easy to set up this solution and collect metrics from the application and EKS itself, but it can be very expensive. Teams must only scrape necessary metrics and track spending if they want to use CloudWatch Container Insights for metrics from many applications.
Tracing
AWS X-Ray
Where logging provides an overview of discrete, event-triggered logs, tracing encompasses a much wider, continuous view of an application. The goal of tracing is to follow a program’s flow and data progression. As such, there is a lot more information at play; tracing can be noisier than logging – which is intentional. We recommend using AWS X-Ray for application request tracing inside AWS infrastructure.
AWS X-Ray is a service that collects data about requests served by applications and provides tools for viewing, filtering, and gaining insights into data that can identify issues and opportunities for optimization. For any traced request, developers can see detailed information not only about the request and response but also about calls that applications make to downstream AWS resources, microservices, databases, and HTTP web APIs.
X-Ray provides an end-to-end visualization of requests and the ways in which they work in an application. The tool can be integrated with other AWS services, like databases or lambda functions, and show a map of an application’s underlying components. AWS X-Ray can be extremely helpful for debugging and analyzing applications in development or in production environments.
Conclusion – Microservices Observability
Microservices observability is a wide area of research with many applicable design patterns and suitable services. It’s essential to understand common approaches to design patterns, as well as the complexity of the process.
An observable system allows developers to understand and measure the internals of a system so that they can more easily navigate from the effects to a root cause — even in a complex microservice architecture.
Get in touch today to speak with a cloud expert and discuss how we can help:
Call us at 1-800-591-0442
Send us an email at sales@clearscale.com
Fill out a Contact Form
Read our Customer Case Studies